The U.S. Cities That Manufacture Your Grocery Staples
As concerns about food safety and supply chain resilience continue to make headlines—including the current cyclospora outbreak—researchers at Trace One analyzed Bureau of Labor Statistics data to identify the U.S. cities and states where food manufacturing plays the largest role in the local economy. The study ranks locations by the concentration of food manufacturing employment, revealing where America's food production workforce is most heavily concentrated and where the industry has the greatest economic footprint.
The U.S. Cities That Manufacture Your Grocery Staples

Photo Credit: Nanderdewijk / Shutterstock
U.S. food manufacturing reached a record 1.77 million workers in 2025, yet the industry now accounts for a smaller share of the nation's workforce than it did decades ago. Despite this long-term decline in employment concentration, food manufacturing remains one of America's largest manufacturing sectors, supplying the grocery staples that households rely on every day. Every loaf of bread, carton of milk, package of frozen vegetables, and box of cereal passes through a manufacturing facility where raw agricultural commodities are transformed into finished products. In addition to stocking supermarket shelves, the industry adds value to American agriculture, supports extensive transportation, packaging, warehousing, and equipment supply networks, and provides stable employment in communities across the country.
To better understand where America's grocery staples are made, Trace One—a product lifecycle management and regulatory compliance software provider serving food and beverage, retail, cosmetics, and chemicals manufacturers—analyzed employment and establishment data from the U.S. Bureau of Labor Statistics' Quarterly Census of Employment and Wages (QCEW), which covers more than 95% of U.S. wage and salary employment. The analysis examines long-term employment trends in food manufacturing, compares employment across major food manufacturing industries, and identifies the metropolitan areas where food manufacturing workers are most concentrated, offering a snapshot of the regions that help keep America's grocery shelves stocked.
Here are the key takeaways from the analysis:
- Food manufacturing employment reached a record high in 2025 despite becoming a smaller share of the U.S. workforce. The industry employed 1,774,702 workers in 2025, up 11% from 1,600,921 in 2020, while its employment concentration declined from 14.0 workers per 1,000 U.S. employees in 1990 to just 11.4 in 2025.
- Animal slaughtering and processing is the nation's largest food manufacturing employer, while bakeries have the most facilities. Animal slaughtering and processing employed 556,070 workers across 4,698 establishments, compared with 346,864 workers across 16,081 bakery and tortilla manufacturing establishments.
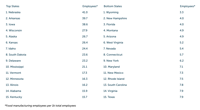
- The American Heartland remains the center of food manufacturing. Nebraska led the nation with 41.0 food manufacturing workers per 1,000 total employees, followed by Arkansas (39.7), Iowa (38.6), and Wisconsin (27.9).
- Food manufacturing is especially important to the economies of many smaller metropolitan areas. Dodge City, Kansas, ranked first with 170.3 food manufacturing workers per 1,000 total employees, ahead of Fort Morgan, Colorado (119.6), Hereford, Texas (114.0), and Le Mars, Iowa (111.3).
U.S. Food Manufacturing Employment Over Time

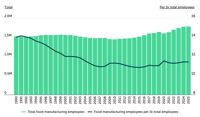
Despite recent growth, the share of overall employment in food manufacturing is near historic lows
Source: Trace One analysis of U.S. Bureau of Labor Statistics data
Food manufacturing was one of the few industries deemed essential during the COVID-19 pandemic, allowing factories to continue operating while much of the U.S. economy slowed or shut down. But remaining open did not mean business as usual. As restaurants curtailed operations and millions of Americans prepared more meals at home, demand shifted rapidly toward grocery stores, meal kits, and other retail food products. Food manufacturers responded by ramping up production while navigating workforce shortages, new safety protocols, and supply chain disruptions. After employment dipped from 1.63 million workers in 2019 to 1.60 million in 2020, the industry recovered steadily, reaching a record 1.77 million employees in 2025—an increase of nearly 11% from the pandemic low.
Even as total employment has reached a historic high, food manufacturing represents a smaller share of the U.S. workforce than it did a generation ago. The industry employed 14.0 workers per 1,000 U.S. employees in 1990, compared to just 11.4 per 1,000 in 2025, a decline of nearly 19%. Rather than reflecting weaker demand for domestically manufactured food, the trend largely mirrors faster employment growth elsewhere in the economy alongside persistent labor shortages within food manufacturing. Food manufacturing is an inherently labor-intensive sector, and to maintain output with limited staffing, manufacturers have increasingly turned to automation, software to manage the increasingly complicated product lifecycle, and other process improvements.
“Every product on a grocery shelf carries a documentation trail behind it. Ingredients, allergens, packaging, labeling. That trail grows every year, and managing it well is now part of how food manufacturers compete.” — Saida Ait, VP Global Marketing, Trace One
Which American Food Manufacturing Industries Employ the Most People?

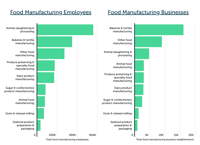
While bakeries lead in terms of total establishments, animal slaughtering and processing employs the most people by far
Source: Trace One analysis of U.S. Bureau of Labor Statistics data
Food manufacturing encompasses dozens of industries that produce everything from bread and dairy products to meat, beverages, and frozen foods. While these industries all play an important role in supplying America's grocery stores, they differ substantially in size, workforce needs, and economic impact. Some industries consist of thousands of small production facilities, while others rely on fewer but much larger plants that employ hundreds—or even thousands—of workers. Comparing both employment and the number of establishments provides a more complete picture of how each sector contributes to the nation's food manufacturing economy.
Bakeries and tortilla manufacturing accounted for the largest number of food manufacturing establishments in 2025, with 16,081 facilities nationwide—more than the next two categories combined. Yet when measured by employment, animal slaughtering and processing stands apart from every other segment, employing 556,070 workers—exceeding the second-largest employer, bakeries and tortilla manufacturing (346,864 workers), by over 200,000. Other major employers include produce preserving and specialty food manufacturing (173,857) and dairy product manufacturing (168,201).
Which States Have the Most Food Manufacturing Jobs?

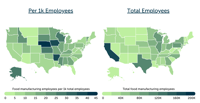
U.S. food manufacturing workers are concentrated in the American Heartland
Source: Trace One analysis of U.S. Bureau of Labor Statistics data
Although food manufacturing facilities operate in every state, the industry's workforce is most heavily concentrated across the American Heartland, where generations of agricultural production, abundant raw materials, and extensive rail and highway networks have made the region a natural hub for food processing. States in the Midwest and Great Plains consistently rank among the nation's leaders when food manufacturing employment is measured relative to the size of their overall workforce, underscoring the industry's outsized role in many local economies.
Nebraska leads the nation with 41.0 food manufacturing workers per 1,000 total employees, followed by Arkansas (39.7), Iowa (38.6), and Wisconsin (27.9). Kansas (26.4), South Dakota (23.6), Minnesota (16.3), Illinois (16.2), and Missouri (15.6) also rank among the states with the largest food manufacturing footprints, reinforcing the concentration of the industry throughout the Midwest and surrounding agricultural regions. When measured by total employment rather than workforce concentration, the picture shifts toward the nation's largest states. California employs the most food manufacturing workers (166,772), followed by Texas (111,619), Illinois (98,222), Pennsylvania (82,533), and Wisconsin (82,011).
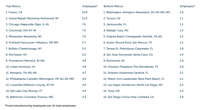
Food manufacturing's economic importance becomes even more apparent at the local level, where a handful of communities are built around large processing facilities. Dodge City, Kansas, has the nation's highest concentration of food manufacturing employment, with 170.3 workers per 1,000 total employees, followed by Fort Morgan, Colorado (119.6), Hereford, Texas (114.0), and Le Mars, Iowa (111.3). These communities are home to major meatpacking, dairy, and agricultural processing operations, making food manufacturing a cornerstone of their local economies. By comparison, the nation's largest metropolitan areas tend to have more diversified labor markets, even when they employ tens of thousands of food manufacturing workers.
Among large metropolitan areas, Fresno, California, has the highest concentration of food manufacturing employment (13.9 workers per 1,000 employees), reflecting the San Joaquin Valley's role as one of the world's most productive agricultural regions. Grand Rapids, Michigan (11.5), Chicago (7.6), and Cincinnati (7.5) also rank among the nation's leading large metropolitan food manufacturing hubs, illustrating how access to agricultural production, skilled labor, and transportation infrastructure continues to shape where food manufacturers locate their operations.
Below is a breakdown of food manufacturing employment across the top and bottom states and large metropolitan areas. The analysis was conducted by Trace One using data from the U.S. Bureau of Labor Statistics. To view complete data, visit the original analysis—The U.S. Cities That Manufacture Your Grocery Staples—on Trace One. For more information refer to the Methodology section.
Which Large U.S. Metros Have the Most Food Manufacturing Jobs?

Which States Rely Most on Food Manufacturing?

Methodology

Photo Credit: Nanderdewijk / Shutterstock
This analysis—conducted by researchers at Trace One—used 2025 Annual Average employment and establishment data released on June 2, 2026 from the U.S. Bureau of Labor Statistics' Quarterly Census of Employment and Wages (QCEW) for industries classified under the North American Industry Classification System (NAICS) 311, Food Manufacturing. Historical employment trends were also drawn from the QCEW to examine changes in food manufacturing employment and its share of the overall U.S. workforce between 1990 and 2025.
State rankings were based on both total food manufacturing employment and food manufacturing workers per 1,000 total employees. Metropolitan rankings used the same employment concentration metric and included only metropolitan and micropolitan statistical areas with at least one component county reporting disclosed food manufacturing employment data. For brevity, the term "metropolitan areas" refers to both metropolitan and micropolitan statistical areas throughout this analysis.
Additionally, the QCEW suppresses certain employment data to protect the confidentiality of individual employers. Employment figures are not disclosed when an industry in a particular geographic area contains fewer than three establishments or when a single employer accounts for more than 80% of total industry employment. As a result, some metropolitan and micropolitan areas may reflect slightly understated employment totals due to these confidentiality protections.
For complete results, see The U.S. Cities That Manufacture Your Grocery Staples on Trace One.
Originally published on traceone.com, part of the BLOX Digital Content Exchange.

(0) comments
Welcome to the discussion.
Log In
Keep it Clean. Please avoid obscene, vulgar, lewd, racist or sexually-oriented language.
PLEASE TURN OFF YOUR CAPS LOCK.
Don't Threaten. Threats of harming another person will not be tolerated.
Be Truthful. Don't knowingly lie about anyone or anything.
Be Nice. No racism, sexism or any sort of -ism that is degrading to another person.
Be Proactive. Use the 'Report' link on each comment to let us know of abusive posts.
Share with Us. We'd love to hear eyewitness accounts, the history behind an article.