How Common Are Foodborne Disease Outbreaks and Where Do They Typically Originate?
A new analysis from Trace One identifies which U.S. states report the most foodborne disease outbreaks—when two or more people become ill from the same contaminated food or drink—using the latest CDC data to map where and how outbreaks most often begin, and how rates have shifted in the years since the COVID-19 pandemic.
How Common Are Foodborne Disease Outbreaks and Where Do They Typically Originate?


Photo Credit: Shisu Ka / Shutterstock
Each year, an estimated 48 million Americans suffer from foodborne illnesses. While many cases are isolated, others stem from outbreaks—when two or more people become ill from the same contaminated food or drink. These outbreaks are particularly important to track, as they often reveal systemic failures in food production, processing, or handling.
The CDC’s National Outbreak Reporting System (NORS) monitors these events, collecting data on exposure settings, food sources, and the number of people affected. Unlike other CDC initiatives, which track individual foodborne illnesses, NORS focuses specifically on clusters of illness, offering a clearer view of where food safety risks concentrate.
Outbreaks tend to follow seasonal patterns. Bacterial illnesses often spike in summer, while norovirus—the leading cause of outbreaks—peaks during the colder months. Yet since the start of the COVID-19 pandemic, reported foodborne outbreaks have declined sharply. This trend may reflect temporary changes in behavior, but it also offers lessons for consumers, food preparation workers, and food safety professionals in preventing future illness.
To explore these patterns, Trace One—a regulatory compliance software company for the food and beverage sector—analyzed the latest NORS data, examining how outbreak trends have shifted over time, which foods and settings are most often involved, and how state-level outbreak rates have changed since the pandemic.
How Common Are Foodborne Disease Outbreaks?

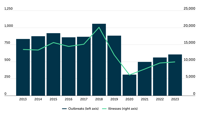
Since the COVID-19 pandemic, foodborne disease outbreaks have dropped by 40%
Source: Trace One analysis of CDC NORS data
In the years following the COVID-19 pandemic, the number of reported foodborne disease outbreaks in the United States has dropped sharply. Between 2021 and 2023, a total of 1,659 outbreaks were recorded, compared to 2,802 outbreaks during the pre-pandemic period of 2017 to 2019—a decline of over 40%. Outbreak-related illnesses fell by a similar margin, down 42% from 47,080 to 27,277 cases.
Several behavioral and structural changes introduced during the pandemic may help explain this continued decline. Better hygiene practices—such as more frequent handwashing, widespread use of hand sanitizer, and increased surface disinfection—became common in both homes and commercial food settings. Many of these practices have persisted, particularly in restaurants, institutional kitchens, and healthcare facilities.
Among these changes, one of the most impactful has been the way food establishments manage sick employees. Ill food workers are a well-documented source of foodborne outbreaks, and the pandemic led to stricter protocols to address this risk. These included more consistent use of gloves, expanded sick leave policies, and stronger efforts to keep symptomatic workers out of the workplace. Together, these measures helped reduce the likelihood of contamination at key points in the food chain.
Where Do Foodborne Outbreaks Originate?

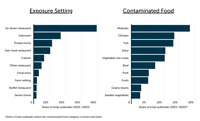
Approximately 40% of foodborne outbreaks originate in sit-down restaurants
Source: Trace One analysis of CDC NORS data
While foodborne illness can originate anywhere, certain settings are consistently linked to a high number of outbreaks. Sit-down restaurants accounted for nearly 40% of all reported outbreaks between 2021 and 2023, making them the most common exposure setting by a wide margin. Fast-food establishments contributed another 10%, while caterers and other types of restaurants collectively made up a similar share. Outbreaks linked to private homes represented 11.4% of cases. Notably, in nearly 17% of outbreaks, the specific setting could not be determined—underscoring the challenges in tracing the origin of many foodborne illnesses.
Outbreaks are also more likely to be associated with certain food categories. Mollusks, including oysters and clams, were associated with 18.3% of outbreaks where a specific food source was identified. These shellfish are often consumed raw and can harbor pathogens like norovirus or Vibrio when harvested from contaminated waters. Other frequently implicated foods included chicken (13.4%), fish (13.1%), and dairy products (10.6%).
Row crop vegetables (10.4%), such as lettuce and spinach, were also commonly involved in outbreaks. These vegetables are typically consumed raw and can be contaminated during growing, harvesting, or processing. They are also a frequent subject of food recalls, reflecting their broader vulnerability to contamination. Beef (7.4%) and pork (5.4%) were regularly associated with outbreaks due to E. coli and Salmonella contamination.
Which States Report the Most Foodborne Disease Outbreaks?

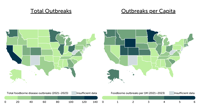
California & Ohio experienced the greatest number of outbreaks over the past three years
Source: Trace One analysis of CDC NORS data
California and Ohio recorded the highest number of foodborne outbreaks from 2021 to 2023, with 139 and 97 outbreaks, respectively. Illinois (94) and Minnesota (90) followed closely, while Washington (84) and Colorado (74) also ranked among the top states by total outbreaks. These figures partly reflect population size and reporting capacity, though not always. Texas and New York, for example, ranked only 15th and 17th for total outbreaks despite being the second- and fourth-largest states by population.
On a per-capita basis, Rhode Island (5.8 outbreaks per million residents), Minnesota (5.2), and Wyoming (5.2) reported the highest outbreak rates, followed by Utah (4.5), Colorado (4.2), and Alaska (3.6). Rates were generally higher in the Mountain West, Midwest, and West, while Southern states reported far fewer outbreaks relative to their populations.
Most states saw sharp declines in outbreak and illness rates compared with 2017–2019, which reflect improvements in food safety practices coming out of the COVID-19 pandemic. Large states like Texas, New York, Florida, and Michigan recorded decreases of 60–75%, in line with the national trend. But eight states reported increases in outbreak rates, including smaller states like Idaho, Wyoming, and Maine, as well as larger states such as Alabama and Arizona. These increases may reflect better outbreak detection in states with limited prior reporting, or one-off local events that drove numbers higher. Large swings—especially in smaller states—can also result from small sample sizes, where a handful of outbreaks or a single large event significantly alters rates.
Overall, higher numbers of reported outbreaks do not necessarily indicate a greater true burden of illness. Differences often reflect variation in surveillance capacity, laboratory resources, and investigation practices as much as actual disease occurrence. States with stronger public health systems are better positioned to detect and document outbreaks, while under-resourced states may underreport them.
For a complete breakdown of outbreaks and illnesses, including per-capita rates and changes over time, see How Common Are Foodborne Disease Outbreaks and Where Do They Typically Originate? on Trace One.
Methodology


Photo Credit: Shisu Ka / Shutterstock
This analysis draws on data from the Centers for Disease Control and Prevention (CDC) National Outbreak Reporting System (NORS), which tracks foodborne disease outbreaks across the U.S., including details on outbreak size, exposure setting, and implicated food categories.
The report covers two three-year periods: a pre-COVID baseline (2017–2019) and the latest post-pandemic period with available data (2021–2023). Researchers examined total outbreaks and related illnesses nationally and by state. National figures include multi-state outbreaks, while state-level data reflect only single-state incidents.
To better compare states, annual outbreak and illness rates were calculated per one million residents and averaged over each period. Percentage changes between the two periods were used to assess changes in outbreak frequency and impact.
For complete results, see How Common Are Foodborne Disease Outbreaks and Where Do They Typically Originate? on Trace One.
Originally published on traceone.com, part of the BLOX Digital Content Exchange.


(0) comments
Welcome to the discussion.
Log In
Keep it Clean. Please avoid obscene, vulgar, lewd, racist or sexually-oriented language.
PLEASE TURN OFF YOUR CAPS LOCK.
Don't Threaten. Threats of harming another person will not be tolerated.
Be Truthful. Don't knowingly lie about anyone or anything.
Be Nice. No racism, sexism or any sort of -ism that is degrading to another person.
Be Proactive. Use the 'Report' link on each comment to let us know of abusive posts.
Share with Us. We'd love to hear eyewitness accounts, the history behind an article.