
Which states have the biggest gap between home sleep therapy need and access
Sleep has become one of the most tracked health categories among Americans, with nearly half (48%) using wearable devices to track sleep, up from 35% in 2023, according to the American Academy of Sleep Medicine. Nearly three-quarters of the same respondents (76%) have lost sleep due to sleep problems. Sleep matters more to people than ever, and most still aren't getting enough.
Paying attention to sleep and being able to treat its disorders are two different things. A new analysis by Vitality Medical, The Sleep Apnea Access Index, ranks all 50 states and the District of Columbia to answer one uncomfortable question: Where are people struggling with poor sleep while the system for home treatment is the thinnest?
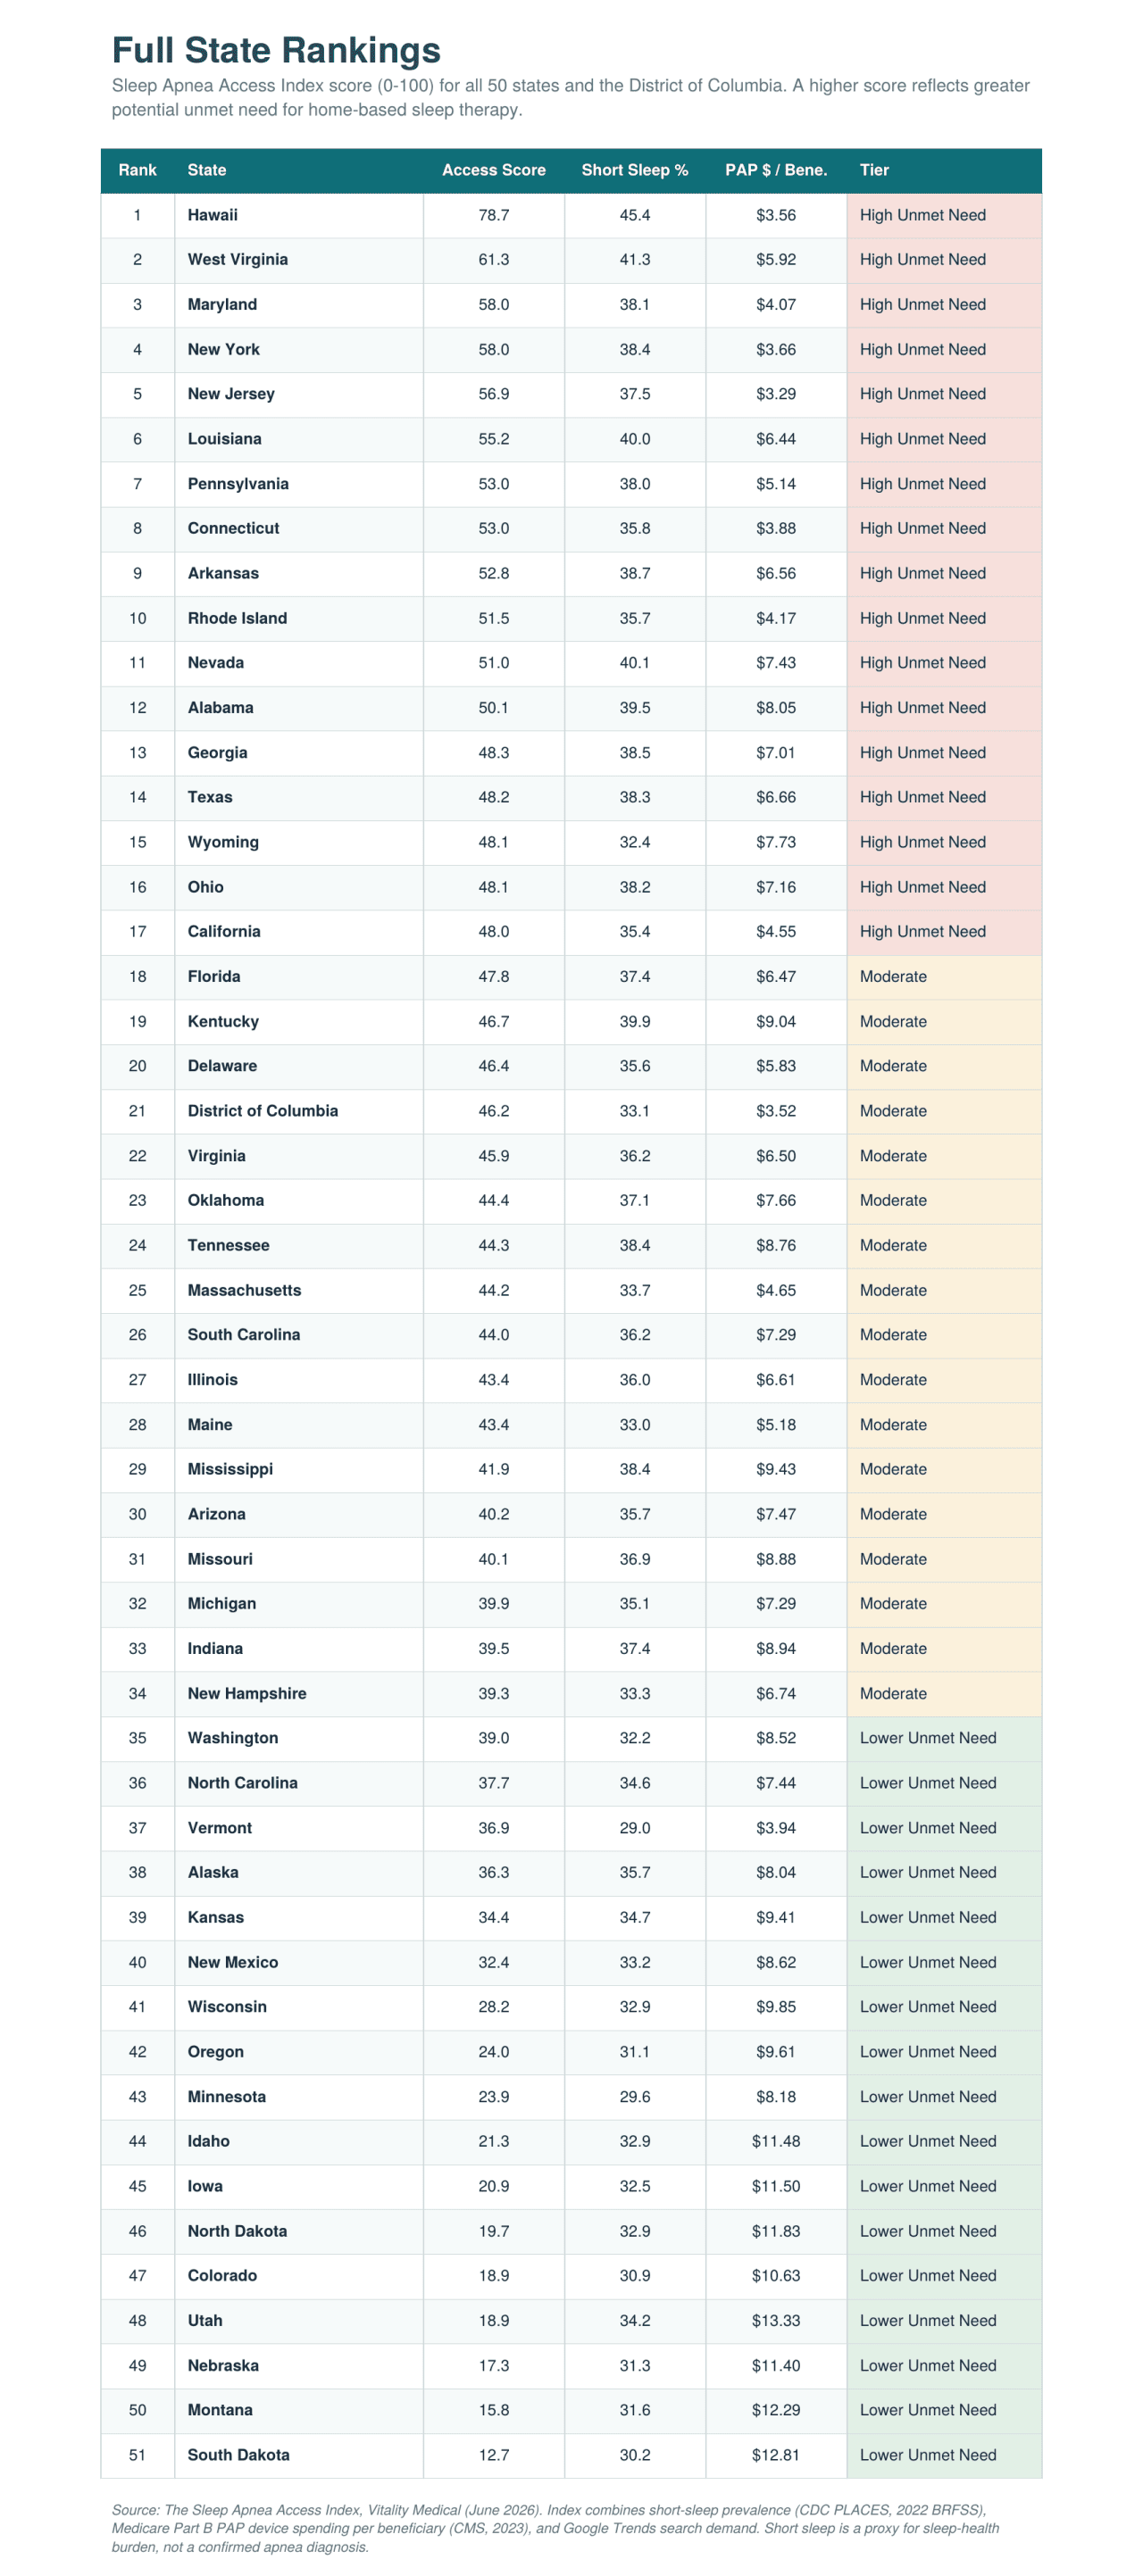
Hawai‘i lands at the top with a score of 78.7 out of 100. Almost half (45.4%) of adults living in Hawai‘i report fewer than seven hours of sleep a night, the highest short-sleep rate in the country, yet Medicare spending on home airway-pressure devices sits at just $3.56 per beneficiary. The state has a high sleep burden but a low spending per beneficiary. This combination may point to potential unmet sleep therapy needs. And it lands at a rough moment for the people who depend on these machines.
How Home Sleep Therapy Actually Reaches People
Before the rankings make sense, it helps to walk the path a person travels from poor sleep to a working machine at home. It is rarely a single step.
It usually starts with symptoms: loud snoring, gasping awake, daytime exhaustion. A primary care visit leads to a referral, then a sleep study, either in a lab or with an at-home test. If that study returns a diagnosis of obstructive sleep apnea, a physician writes a prescription for positive airway pressure therapy, the category that includes CPAP and BiPAP machines. From there, the prescription goes to a durable medical equipment (DME) supplier, the business that actually delivers the device. Insurance, often Medicare for older adults, has to approve coverage. Then the machine is set up, fitted with a mask, and the person begins therapy.
The machines also need updates. Masks wear out, cushions degrade, tubing needs replacing, and filters have to be swapped on a schedule. Ongoing resupply is what keeps the therapy working month after month. A gap anywhere along that chain (a missed diagnosis, a denied claim, a supplier a person cannot reach, a resupply that never arrives) can leave someone with apnea untreated, even when the technology to help them is decades old and widely available.
The Sleep Apnea Access Index looks for places where the signals along that chain appear mismatched. It combines how much short sleep a state reports, how much Medicare spends on PAP devices per beneficiary, and how often people search for CPAP and sleep apnea terms. Where reported sleep burden runs high, but the spending and demand signals run low, the Index flags a possible gap between the people who might need home therapy and the support reaching them.
Key Findings
- Hawai‘i ranks #1 (78.7/100): The nation's highest short-sleep rate (45.4%) meets one of its lowest device-spending figures ($3.56 per beneficiary).
- A fourfold spending gap divides the country, from $3.29 per beneficiary in New Jersey to $13.33 in Utah.
- The Northeast spends the least on home PAP therapy ($4.51 per beneficiary) while reporting roughly average short sleep. Ten of its 12 states rank in the top 30.
- The South sleeps the least, with a regional short-sleep rate of 38.2% and 10 of 14 states in the top half.
- The Dakotas and Mountain West rank lowest, pairing better sleep with the highest device spending in the country.
- Nationwide, 35.6% of adults report fewer than seven hours of sleep a night.
Hawai‘i: The Country's Sharpest Mismatch
Hawai‘i captures the whole pattern in one state. Its short-sleep rate tops every other state, a sign of real strain on sleep health across the islands. Its Medicare PAP spending runs among the lowest anywhere, $3.56 per beneficiary against a national average of $7.54.
That combination is what pushes Hawai‘i to the top of the Index. Heavy need, low home-therapy spend, and steady search interest in CPAP terms add up to a place where people may be carrying the weight of poor sleep without much support for treating it at home. No other state shows the pattern this plainly.
The numbers also sit against a shifting policy backdrop. For 2026, CMS finalized its Medicare Physician Fee Schedule with a 2.5% efficiency adjustment to many services, and sleep medicine groups have warned that the rule continues a pattern of underpayment for sleep care. Medicare has also been steadily expanding the categories of home equipment that require prior authorization before they are covered, adding approval steps along the path from a physician's order to delivery. A state like Hawai‘i, where home-therapy spending already runs low, those added pressures may be worth watching.
The Northeast: A Spending-Side Gap
If Hawai‘i combines high burden with low support, the Northeast shows what a gap driven mostly by spending looks like. As a region, its short-sleep rate of 35.1% sits just below the national average of 35.6%, though its largest states run higher. This isn't a region that sleeps unusually badly. What stands out is the spending.
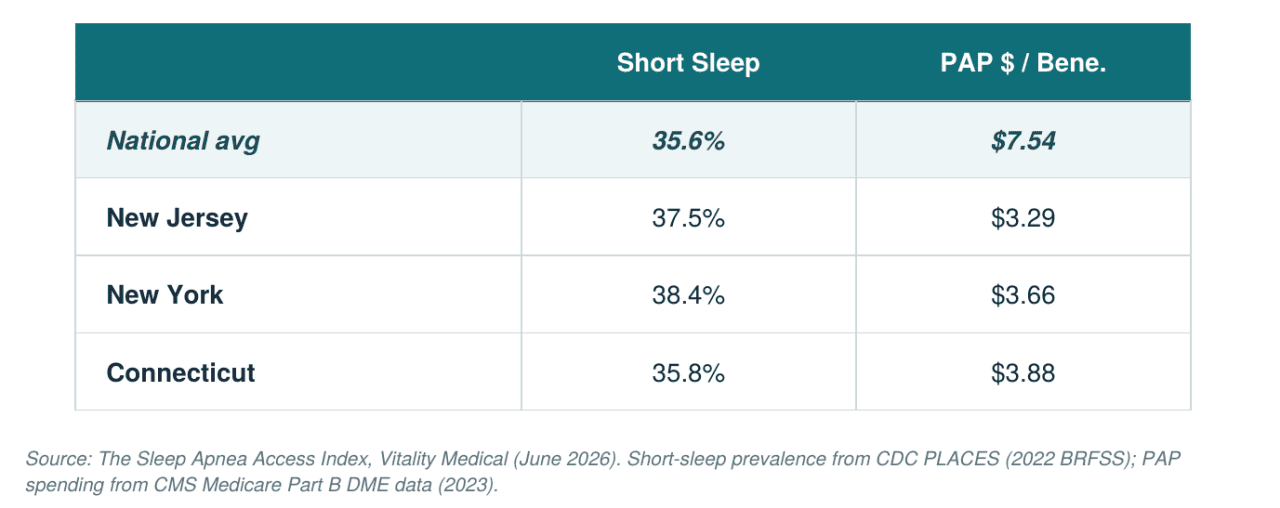
The Northeast records the lowest home PAP spending of any region through Medicare, an average of $4.51 per beneficiary, with New Jersey ($3.29) and New York ($3.66) at the very bottom of the national range.
The result shows up in the rankings: 10 of 12 Northeastern states land in the top 30 of the Index. It's a reminder that a gap doesn't require unusually bad sleep to open. In the Northeast, ordinary sleep burden paired with the country's lowest home-therapy spending is enough to surface a potential mismatch, and it does so in a region with some of the nation's highest-ranked hospital systems.
The South: A Burden-Side Gap
If the Northeast's gap comes from thin spending, the South's comes from the sheer weight of need. The South and Southeast post the country's highest regional short-sleep prevalence at 38.2%, with 10 of the region's 14 states in the top half of the rankings.
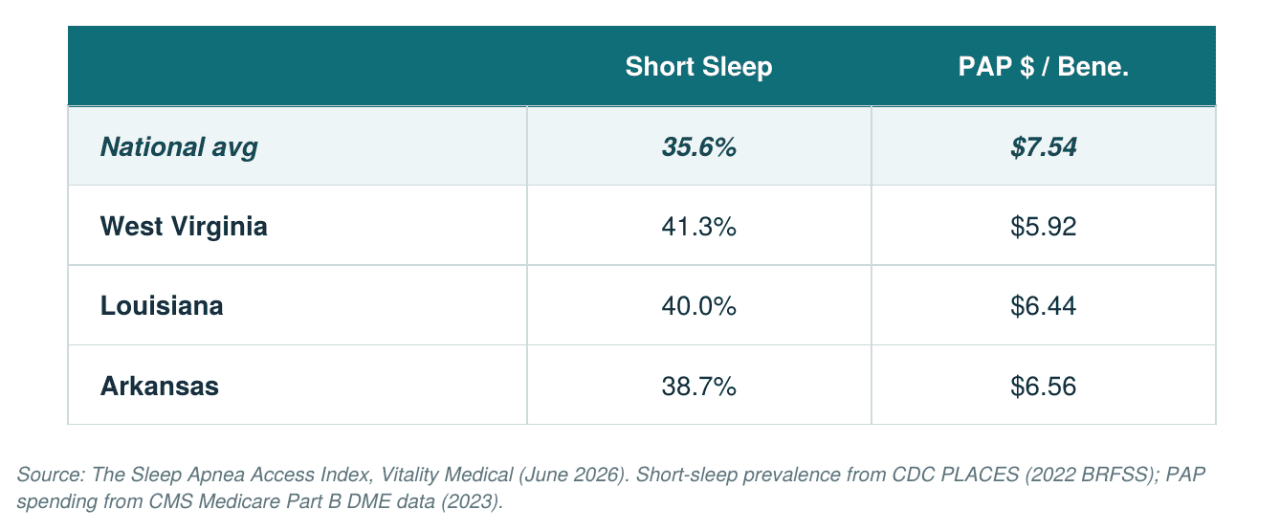
West Virginia (No. 2), Louisiana (No. 6), and Arkansas (No. 9) each report short-sleep rates above 38% while their Medicare PAP spending stays below the national average.




These states also carry some of the country's heaviest chronic-disease burdens. West Virginia, Louisiana, and Arkansas all fall within what researchers call the "diabetes belt," a Southern cluster where diabetes rates run well above the national average. Poor sleep tends to travel with those same conditions; the Centers for Disease Control and Prevention lists sleep apnea among the risks tied to obesity, alongside Type 2 diabetes and coronary heart disease. Where the underlying burden runs this high, even average home-therapy support may leave a meaningful share of people underserved.
Context: A Recall and a Tighter System
The state and regional gaps sit on top of two national pressures worth naming carefully. Neither is captured in the Index, and neither falls on one state more than another. They describe the environment every state is operating in.
Supply has gotten shakier. The recall of one of the most dominant CPAP and BiPAP makers, Philips, created uneven ground across the market. Philips agreed to a consent decree restricting future sales as part of a settlement with regulators, after a recall that covered an estimated 15 million devices worldwide. When a dominant manufacturer pulls back, the resupply chain that keeps therapy working can tighten for everyone who depends on it.
Access is only one part of the picture. Before access is gained, many cases are never identified at all: an estimated 80% of sleep apnea cases remain undiagnosed, which the AASM attributes in part to limited awareness among the public and health care professionals.
These two forces don't change the rankings, but they raise the stakes behind them. A potential gap is easier to close when devices are plentiful, and diagnosis is routine. Right now, neither is guaranteed, which means the places the Index already flags, where sleep burden looks high, and support signals look thin, are the places with the least margin if the broader system gets harder to navigate.
The Other End of the Map
The bottom of the Index is just as telling as the top. South Dakota (No. 51), Montana (No. 50), Nebraska (No. 49), Utah (No. 48), and Colorado (No. 47) close out the rankings, and they share a profile: low short-sleep rates paired with higher Medicare PAP spending. Utah spends $13.33 per beneficiary, nearly four times what New Jersey spends.
A low score suggests that short-sleep rates and Medicare PAP spending appear more aligned within the index. The Index is a measure of potential unmet need, so the states doing better land lower. That fourfold spending spread, from $3.29 in New Jersey to $13.33 in Utah, is the single clearest sign of how unevenly home sleep therapy is reimbursed across the country.
Top 5: The Widest Gaps Between Need and Support
These five states show the largest mismatch between how much people are struggling with sleep and how much home-therapy support is reaching them.
- Hawai‘i (78.7): The nation's highest short-sleep rate (45.4%) paired with one of its lowest PAP spending figures ($3.56 per beneficiary).
- West Virginia (61.3): A short-sleep rate of 41.3%, second-highest in the index, against below-average PAP spending of $5.92.
- Maryland (58.0): A 38.1% short-sleep rate with PAP spending of $4.07, among the lowest in the country.
- New York (58.0): A 38.4% short-sleep rate paired with $3.66 in PAP spending per beneficiary.
- New Jersey (56.9): The lowest Medicare PAP spending per beneficiary in the country at $3.29, alongside a 37.5% short-sleep rate.
Bottom 5: Where Need and Access Appear to Line Up
These five rank lowest because their sleep burden is comparatively low and their home-therapy spending is high, a sign that the support system is roughly meeting demand.
- South Dakota (12.7): The lowest score in the index, with a 30.2% short-sleep rate and $12.81 in PAP spending per beneficiary.
- Montana (15.8): A 31.6% short-sleep rate against $12.29 in PAP spending.
- Nebraska (17.3): A 31.3% short-sleep rate with $11.40 in PAP spending per beneficiary.
- Utah (18.9): The highest PAP spending per beneficiary in the country at $13.33, with a 34.2% short-sleep rate.
- Colorado (18.9): A 30.9% short-sleep rate paired with $10.63 in PAP spending.
Summary
The map this study draws doesn't follow the lines you'd expect. Wealthy Northeastern states and hard-pressed Southern ones land near each other at the top, for opposite reasons, while much of the Midwest and Mountain West sits at the bottom because the signals there appear to align. Geography seems to shape how sleep burden and Medicare PAP spending line up.
What stays with you is the human shape under the numbers. Behind the 45.4% in Hawai‘i and the $3.29 in New Jersey are people sleeping badly, while, for some, the device that might help sits a few more steps down the path than it should. Those steps are not getting easier: payment pressures and added approval requirements are pulling in the wrong direction. Short sleep is a proxy, not a diagnosis, and the study is careful not to claim otherwise. But proxies point somewhere, and this one points toward a lot of people who could rest easier than they do.
The work ahead is unglamorous: clearer coverage, shorter waits, a steadier supply of machines, and the masks and tubing that keep them running. None of it makes headlines on its own. For a person relying on home PAP therapy, those basics can shape whether treatment stays on track.
Methodology
To understand how Americans access home sleep therapy, we built the Sleep Apnea Access Index across all 50 states and the District of Columbia. The Index combines three signals into a single 0-100 score, where a higher score reflects greater potential unmet need for home-based sleep therapy support.
Short-sleep prevalence (40% of the score) comes from CDC PLACES data based on the 2022 BRFSS survey, measuring the share of adults reporting fewer than seven hours of sleep per night, aggregated to the state level. Medicare PAP device spending (35%, inverted) comes from CMS Medicare Part B Durable Medical Equipment data for 2023, covering CPAP and BiPAP device codes (E0601, E0470, E0471), divided by the state's original Medicare fee-for-service enrollment; lower spending per beneficiary raises a state's need score. Google Trends search demand (25%) averages state-level interest across five terms (CPAP machine, sleep apnea treatment, CPAP mask, sleep apnea symptoms, and CPAP supplies) over the trailing 12 months. Each component was min-max normalized across the 51 locations before weighting.
A few limits are worth stating plainly. Short sleep is a proxy for sleep-health burden, not a confirmed sleep apnea diagnosis; many factors shorten sleep, and the Index makes no clinical claim about actual apnea rates by state. The Medicare DME data covers fee-for-service beneficiaries only, so Medicare Advantage claims aren't captured, and the fee-for-service share varies by state. Spending is attributed to the referring physician's state, which can introduce minor misattribution in border or rural areas.
This story was produced by Vitality Medical and reviewed and distributed by Stacker.

(0) comments
Welcome to the discussion.
Log In
Keep it Clean. Please avoid obscene, vulgar, lewd, racist or sexually-oriented language.
PLEASE TURN OFF YOUR CAPS LOCK.
Don't Threaten. Threats of harming another person will not be tolerated.
Be Truthful. Don't knowingly lie about anyone or anything.
Be Nice. No racism, sexism or any sort of -ism that is degrading to another person.
Be Proactive. Use the 'Report' link on each comment to let us know of abusive posts.
Share with Us. We'd love to hear eyewitness accounts, the history behind an article.